Recent issues of The Wall Street Journal (September 12th’s edition ran “ESG Does Neither Much Good nor Very Well”) and The Economist (July 23rd’s cover was “ESG: Three Letters that Won’t Save the Planet”) illustrate a growing backlash against “ESG” even as scrambled supply chains suffer further interruptions from droughts and flooding. A 60/40 portfolio, made up of the SP500 SPX and the Barclays U.S. Aggregate, lost 16% in 2022; after 2008’s 21% loss, this was the second worst performance since 1976, Barron's reports. Seemingly disparate recent headlines relating to ESG, water troubles, and market trends may in fact offer opportunities for investors. The water industry, in particular, warrants a closer look.
Global water security is a significant impact and investment opportunity. The World Economic Forum lists finance as a key to achieving global water security as called for within Sustainable Development Goal 6 on water and sanitation. Investors may in particular seek opportunities in initiatives related to irrigation, distribution, and water treatment, and especially now, as investors look for recession-proof businesses to help portfolios during periods of market and economic weakness. The public sector alone is unable to bridge vast gaps in water-related investment. The Environmental Protection Agency notes that water infrastructure in the United States needs over $400bn in new investment to achieve water security for the future. Many countries face the same problems, prompting even the World Bank to support water utility privatization. European countries, such as the United Kingdom, France, Portugal, Spain, Italy, and Switzerland, are all beginning to spearhead privatization initiatives of water management companies with success.
Not everyone agrees that water should be under private control. Thomas Stephens, an environmental justice activist, told listeners of Democracy Now that “the very essence of life itself, water, is being privatized and being subjected to a corporate bottom-line approach that is in violation of the human rights of the people, [especially] the most vulnerable people” While the privatization of the water industry can improve overall water security, less equitable access to water can result. The Guardianunderscores that “water isn’t a private commodity, but a necessity of life, making access to it a public good. And steps need to be taken to ensure that access remains open.” Private water suppliers generally operate their businesses with little economic regulation and tend to raise prices. Thus, growth in private water companies could lead to socioeconomic inequities and, on a global scale, create conflict between developed and developing nations. Nevertheless, as Israel shows, a solution may exist. Improving security solely by increasing supply will be extremely difficult and expensive. Instead, governments will need to focus on managing demand by raising the price of water. Israel charges a high price for water but achieves its goal of water security while remaining fair to its people by subsidizing water costs for those on social welfare. Water’s high price encourages Israelis to conserve water or implement technological advancements to improve water-use efficiency. By contrast, water is extremely cheap in most other parts of the world. Low prices, while convenient for consumers, lead to immense waste. Israel has a remarkably low leak factor of about 7-8%, because it is cheaper to fix leaky pipes than waste water. In contrast, some areas in the United States have supply systems that lose up to 50% of the water flowing through them.
Other niche opportunities for investments by private capital investors lie in the development of cutting-edge technologies that monitor how water is used and provide insight into best practices for water security. McKinsey found that “Israel has leveraged its culture of innovation to establish itself as an international hub for water-technology development, increasing its water security while establishing a local multibillion-dollar industry.” Given the inherent scarcity of water, technological innovations made by these companies are indispensable. Desalination, wastewater treatment, and water recycling technologies are all areas with high growth potential. In fact, the water and wastewater treatment market is projected to grow from USD 301.77 billion in 2022 to USD 489.07 billion in 2029 at a CAGR of 7.1%, according to one study. In sum, investors are positioned to create positive change while simultaneously generating consistent returns. Water investments, with appropriate safeguards to protect the most vulnerable, can have real impacts on sustainability goals, address water security crises, and may produce solid financial returns.
ESG and impact strategies – and their returns
After five years of positive flows into ESG-focused strategies in the public markets, it is unsurprising that sustainability-oriented investing (here, we use “ESG” and “sustainable” interchangeably) is coming under scrutiny. For example, the Jul 23, 2022 edition of The Economist ran a cover that said “ESG: Three letters that won’t save the planet.” Bloomberg, in June, reported on how ESG funds had fared less badly than the broader market in 2022 so far, despite owning relatively more technology names and relatively fewer energy stocks. Yet it also noted that over the last five years, Global, US and European ESG portfolios had each not kept up with their broader respective markets. (No extra information about how funds were categorized into either ESG or non-ESG groups was included, but Bloomberg did point out the finding was consistent across geographies.)
This conclusion is at odds with work that looks at performance over longer time periods. A 2015 paper noted that studies up to that point had generally only reviewed a fraction of the available literature, and sought to remedy this by extracting “all provided primary and secondary data of previous academic review studies.” And, the authors continue, “through doing this, the study combines the findings of about 2200 individual studies” which date back to 1982. This work found that overall, about 9% of the prior papers found a negative relationship between ESG and what they label corporate financial performance, or “CFP.” 63% of the studies found a positive relationship, and the balance could find no relationship at all. Of note, this conclusion is stable over time, across different geographies, and across asset classes. Some studies looked at E, S, and G separately, and some together, some focused on equities, or fixed income, or real estate, or were portfolio-wide.
Another paper, from about the same time, looks at the question of sustainability and financial performance from a different angle. Eccles and his co-authors created 90 matched pairs of firms, where one of the pair was labeled “high sustainability” and the other “low sustainability”, but in most other respects – such as industry, size, capital structure and growth opportunities – were very similar. Companies were placed in one category based on whether they had adopted a “substantial number of policies…for a significant number of years (since the early to mid-1990s), reflecting strategic choices that are independent and in fact, far preceded the current hype around sustainability issues.” As one would expect, “high sustainability” companies are more likely to create a dedicated committee at the board level to supervise sustainability-related questions, and to tie the pay of company leadership to customer satisfaction, social and environmental performance. Most notably, the “high sustainability” group outperformed their peers over the 1993 to 2009 time span, “both in terms of stock market and accounting performance” – such as return on equity and return on assets. Furthermore, this difference is more marked among companies that sell based on reputation/brand, “business-to-consumer” companies, and those that make “substantial use of natural resources.”
Given how quickly the space has been evolving, it is worth looking at more recent research, even if it examines shorter time frames. A paper from mid-2022 does just that, and focused its analysis on papers that were published since the 2015 meta-analysis referenced above. It found roughly the same number of unique studies as did the 2015 paper, which looked back over 30-plus years. The main conclusions from this work are twofold. First, there is a good evidence to connect ESG with superior corporate financial performance at the level of an individual operating company. This is consistent with the findings of Eccles et al. Second, the study found that “the financial performance of ESG investments is indistinguishable from conventional investments.” As the authors note, this inconsistency is puzzling. Various possible explanations exist, and each is supported by some evidence. These include:
“ESG investing” is too broad a concept to be useful here. It blends strategies that are ethics-driven, and not returns-maximizing, with those ESG strategies that do seek to maximize-returns.
ESG investors can’t implement their strategies effectively because they don’t have access to good sustainability performance data. (The inconsistency of ESG disclosure and data aggregation approaches is well documented.)
The superior corporate financial performance associated with high sustainability companies may quickly be priced in, making it hard to distinguish between the returns of an “ESG portfolio” and a “non-ESG” portfolio over certain time periods.
Based on all this, what conclusions can investors draw? A key principle is understanding the nuances. It is generally preferable to seek portfolios that integrate ESG factors in investment decisions rather than apply inflexible screening rules – and that this integration should rest where possible on the traditional tools of alpha-seeking active portfolio management, whether in the public or private markets. These techniques include engagement with company leadership as well as selectively with the rank and file, comprehension of key industry-wide trends, and the identification of catalysts that can unlock near-term value. For as long as ESG disclosures and ratings systems are hard to trust, these tools may be particularly valuable.
Quantifying the ‘S’: Gender Equity Metrics in the Workplace
This paper explores the metrics that companies can use to measure the experience of women in the workplace more consistently. We take stock of the current state of measurement by evaluating the current parties involved in reporting: Governments, ESG Ratings Providers, Accounting and Disclosure Framework Boards, and Exchanges. We then present a robust suite of metrics that companies should strive to collect and report. This set of metrics, Four for Women, buckets metrics into Representation, Pay, Health, and Satisfaction and comes from Wharton’s Social Impact Initiative.
Impact Investing and Real Estate
This paper is the product of a collaboration between Dream and Impact Delta. Dream is one of Canada’s leading real estate companies, with over $10 billion in assets across North America and Europe. Dream’s purpose is to deliver strong returns while delivering positive impact in the communities where it works. We advised Dream on the launch of its impact investing strategy, which is outlined in this white paper.
Getting Paid for Good Behavior
Investors must understand the full impact of their decisions. Several tools exist to help them
We published a white paper today, which explores the increasing importance of externalities in investment decision-making. Amid the upheavals of 2020, a growing number of investors are convinced they must understand the full impact – financial, environmental, and social – of their decisions. While externalities are inherently hard to measure, more progress on this question has been made than many mainstream investors realize.
These are the main ideas, and the PDF is available for download at the button below.
1) Externalities – or the social and environmental impact of business activity – have never been more important.
Evidence mounts that paying attention to impact is associated with superior performance – a finding that holds across asset classes and geographies.
Growing evidence of climate change, along with shifting narratives and social norms, are influencing behavior among consumers, policymakers and regulators.
2) The importance of environmental, social, and governance (ESG) issues is driving asset owners and managers to demand more disclosure, standardization and transparency.
To uphold their fiduciary duty over 75-year horizons, asset owners and their partners must continue to push for ways to “internalize” externalities through greater disclosure and standardization of non-financial data.
While the measurement of ESG factors is still not streamlined, more progress on capturing “non- financial” performance has been made than many market participants realize. Cheaper and broader access to technology such as geospatial data, artificial intelligence and blockchain will drive transparency too.
3) Investors face a calculus about when to switch camps and incorporate ESG-related preferences, measurement and management into their activities.
As the process of ESG integration remains incomplete, it presents opportunities to freeride – or take bold action.
Investment firms today fall into two broad camps: those that address ESG issues with lip service (“minimum viable effort”), and those that address them with genuine intent (“maximum reasonable effort”).
4) The case for switching now to a full embrace of impact-informed investing, despite the inconsistent data, is strong.
Change will continue to be non-linear. In 2018 zero countries had adopted zero-carbon targets. Today, dozens have, including major economies such as the U.K., France, and China.
Asset flows into high-ESG-quality assets will remain strong. In 2018, sustainable investing assets in developed markets surpassed $30 trillion, increasing by a third with respect to two years before.
5) Switching to a more complete accounting of the impact of investment activities has far-reaching implications for asset manager strategy and operations. Development finance institutions (DFIs) offer many resources to enable this transition.
Reorienting towards impact will affect hiring, training, and compensation; organizational structure; information-sharing systems, shared values and cultural norms; brand evolution and all other activities of investment managers. Firms that take a “high sustainability” approach will develop different processes across the board, and over time will differ markedly from those that don’t.
The biggest single untapped resource for mainstream private equity investors is the development finance community. Organizations like the IFC and the World Bank were launched to address market failures. Their “non-financial” impact is essentially why they exist. Yet the research, data and frameworks they have developed have not been widely explored or adopted by mainstream investors.
An Asset Owner's Guide to ESG
Asset owners’ decisions affect people over the world, so they want to know if investment managers’ ESG efforts are serious. Here are eight things to check.
ESG flows and marketing ramp up
Over the past few years, there has been steady growth in the number of firms and funds that seek to integrate ESG into their investment strategies. According to the UNPRI’s 2019 Annual Report, the organization saw a 20% year-on-year growth in its signatory base; in North America, 456 new signatories joined UN PRI in 2018, and 628 did in 2019. Morningstar’s first Global Sustainable Fund Flows Report, published in May 2020, demonstrates continued appetite for ESG funds in the wake of the COVID selloff. In Q1, sustainable funds globally saw $45.7bn in net inflows, while the overall fund universe saw outflows of $384.7bn.
As ESG-related flows – and marketing – ramp up, asset owners must determine which managers are truly integrating ESG into their thinking, and which managers are addressing ESG at the margins. A question we often hear is “how can we tell if a manager is really integrating ESG, or just doing the minimum to check a box?” Here are eight things to look at. The first four are “inputs”, and the second four are “outputs” — or an overview of areas asset owners must understand.
Things to check
Check the profile of the ESG person/team. Not all firms have an ESG department, but most have a dedicated ESG professional. (If they only have someone who “looks after” ESG on a part-time basis, note that too.) Ideally, the head of ESG will have a mix of investment and operating company experience and be a senior professional with a track record of influencing the C-Suite. From an organizational perspective, the closer this person sits to the deal teams and CIO, the greater the likelihood that the firm is integrating ESG into its investment process. Meaningful integration is less likely if the role is housed in marketing, for example.
Interview the head of ESG together with the investment team during the diligence process. Explore how they work together throughout the investment process. Ask to see the tools the team uses to assess material ESG risks and opportunities. Are they plugging in a score from an ESG data provider, or conducting deep analysis of company disclosures and third-party sources?
Conduct a document review. Does the manager include ESG risks and opportunities as part of their screening process? Is ESG factored into investment committee memos including risk assessments and position sizing? Where in investment committee decks does the section on ESG lie? Is it one page, at the end? Is there evidence that the investment team engages management teams on material ESG issues? Is ESG incorporated into investment stewardship?
Examine the firm’s ESG/sustainability policy. How ambitious, detailed and clear is it? Does the firm describe things it actually did, or things it seeks to do? Does it talk mostly about its charitable giving, or focus on its core activities? To illustrate, compare these two European firms on their own carbon practices. The first firm says “the net CO2e emissions from electricity consumption, scope 2, totaled 0 in 2019.” The second firm, similar in size and strategy, says instead “we aim to reduce [our] carbon footprint by identifying more efficient resource use, and where necessary by paying to offset our carbon emissions.”
Things to form a view on
Understand how ESG risks are assessed across the current portfolio. Has the firm assessed the physical risks of climate change, such as supply chain interruptions, and weather-related damage? Does it understand the costs of mitigating those risks? Would portfolio companies be able to pass through to customers a carbon price of $100 or $150 per metric ton? If not, what would the effect be on EBITDA? These carbon tax figures aren’t imaginary: they lie at the heart of the Energy Innovation and Carbon Dividend Act of 2019 (currently a bill in the House of Representatives). Columbia University researchers in turn found the plan – which would cut American carbon pollution by almost 40% by 2030 – also had the most support in Congress.
Understand the firm’s approach to ESG as a value lever, and as an investment theme.Recent work by PWC report noted “A majority of GPs and LPs do not currently estimate the value created by the ESG activities of their portfolio companies, but many intend to do so. While 41% of GP respondents say they do this, there is still a way to go in terms of moving this forward.” On the investment theme front, is there evidence that the manager is actively considering societal shifts to sustainability and diversity in its deal-sourcing? A long-term ESG outlook can mitigate risk, and unlock investment opportunities.
Evaluate the firm’s approach to training. Do all investment and investor relations professionals receive ESG training? If so, is it a one-off? Or is it reinforced and updated? The same 2019 PWC report found that nearly half of firms do not train their investment teams on ESG.
Evaluate the firm’s approach to ESG in its own management. Does the firm measure and report on its own carbon footprint? How is that footprint managed? As an example, EQT began measuring this in 2015. It has kept emissions per employee at 29 metric tons of carbon dioxide equivalents, and offsets all greenhouse gas emissions that cannot be avoided. Examine the firm’s approach to its suppliers and advisors, as well to its recruiting and promotion. How proactive is it about improving the diversity of its own workforce, and of those businesses and advisors it interacts with?
Asset owners, as well as GPs, are themselves becoming more fluent in ESG concepts. As a group, they are becoming more convinced that ESG themes are not just about values, but about value too; and the shift has been dramatic enough to be called an “investor revolution.” As fiduciaries, it behooves them to be much more detailed and rigorous in their review of asset managers’ ESG practices.
Rethinking ESG in Private Equity
A new era for ESG
We published a white paper today, which explores how PE firms could change their mindset about ESG for the coming decade. These are the main ideas, and the PDF is available for download at the button below.
The recent change in attitudes to environmental questions has been swift, and continues to gather force. The current health and social crises will accelerate changes in attitudes towards other, non-environmental dimensions of ESG factors, such as paid sick leave policies, the provision of healthcare and childcare, and other employee benefits that drive workforce engagement. Diversity and inclusion have gained new urgency. The growing financial materiality of these questions has made asset owners increasingly vocal, and GPs are now trying to catch up. GPs may be tempted to take their old ESG approach, and just do it better. We suggest a different mindset is required: one where ESG becomes a substantial corporate function and value creation tool, informing strategy and operations of the firm and of the portfolio companies. Over time, we expect firm-wide cultural norms will shift to embrace ESG on these new terms.
Growing evidence for ESG’s materiality to returns. Most academic work has reviewed public markets data on this question, mapping share prices and credit spreads on to a company’s ESG practices. Surveys of the literature find many more examples of positive relationships between ESG and corporate financial performance than negative ones. In the context of climate change, covid-19, and racial injustice, ESG factors will become even more financially material.
Increased LP expectations. LP and societal expectations on ESG are increasing quickly, with respect to carbon emissions, virus-related workforce benefits, and diversity. Many LPs have multi-generational investment horizons; for them, addressing climate change will be a central driver of portfolio performance.
A structural change in approach is required to address the challenge. GPs may be tempted to take their old ESG approach, and just do it better. We suggest a different mindset is required: one where ESG becomes a substantial corporate function and value lever, informing strategy and operations of a firm and of its portfolio companies, driving cross-portfolio projects and best practice sharing. This approach can be thought of as “horizontal”— in that it is integrated into and cuts across all of the firm’s activities. A reimagined ESG approach could dramatically alter how deals are sourced, and not just confirm to an investment committee that ESG risks have been assessed.
The present: ESG efforts focused on risk and compliance. In a world of rising demand for the private equity asset class, general partners (GPs) have allocated few resources to their ESG capabilities. Today’s ESG professionals often lack influence. ESG teams are small and more focused on risk mitigation than value creation. Overall, private equity’s ESG efforts lag those at public companies, which have been working on their sustainability strategies for many years.
The future: Leadership, innovation, and cultural change. To close the expectations gap, firms must add or develop senior ESG leaders with strong leadership skills. These people will come from a wider range of backgrounds than most currently serving ESG professionals. Expect more automation, standardization, transparency and innovation, as well as broader pro-ESG shifts in firm culture.
Covid Is Killing Coal
In 2020, renewables will at last account for a bigger share of U.S. electricity generation than coal, thanks to the coronavirus crisis.
The last coal station in New York
The last coal-fired power station in New York state was in the town of Somerset, near Lake Ontario, and about 40 miles north of Buffalo. Known as the Kintigh Generating Station, it was named after Allen Kintigh, the former boss of New York State Electric and Gas (NYSEG). When it opened in 1984, it was one of the cleanest coal-burning power stations in the country, thanks to then state-of-the-art emissions technology. The plant closed in March 2020, and over the last couple of years had only been delivering about 0.5% (0.69 MWh) of all power generation in New York State. The rapid demise of coal is striking: in 2007, the fuel accounted for 21.4 million MWh, or over 14% of the state’s power supply. The closure was a milestone: the only other states to have closed all their coal power stations are California and Idaho.
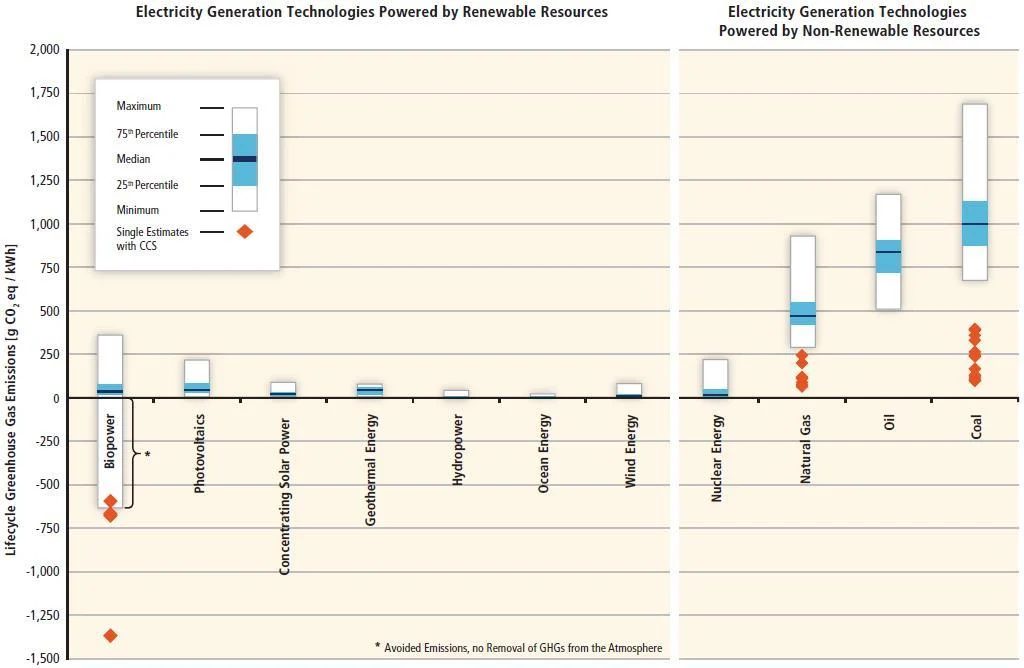
Coal is the dirtiest fossil fuel: it produces between 1.5 and 3.5 pounds of carbon dioxide equivalents (CO2e) for every kWh it generates. A rough rule of thumb for coal in metric terms is: one kilo of CO2 is produced for one kWh of electricity, because one kilo is 2.2 pounds. Natural gas, by contrast, produces 0.6 to 2 pounds.
Dirty and expensive…
Coal is not only dirty, it is also relatively expensive – an important factor in Kintigh’s closure. The dramatic reduction in power demand associated with Covid-19 has delivered another blow against coal: coal-powered plants are moved to idle mode before other fuel types, as power companies manage supply. On Monday (May 11), the EIA reported that coal-powered generation had hit a 42-year low, driven by a low natural gas prices and plummeting demand; of course, the low gas prices are themselves a function of weak demand too. Power usage is set to drop more steeply in 2020 than at any other time in the last 20 years.
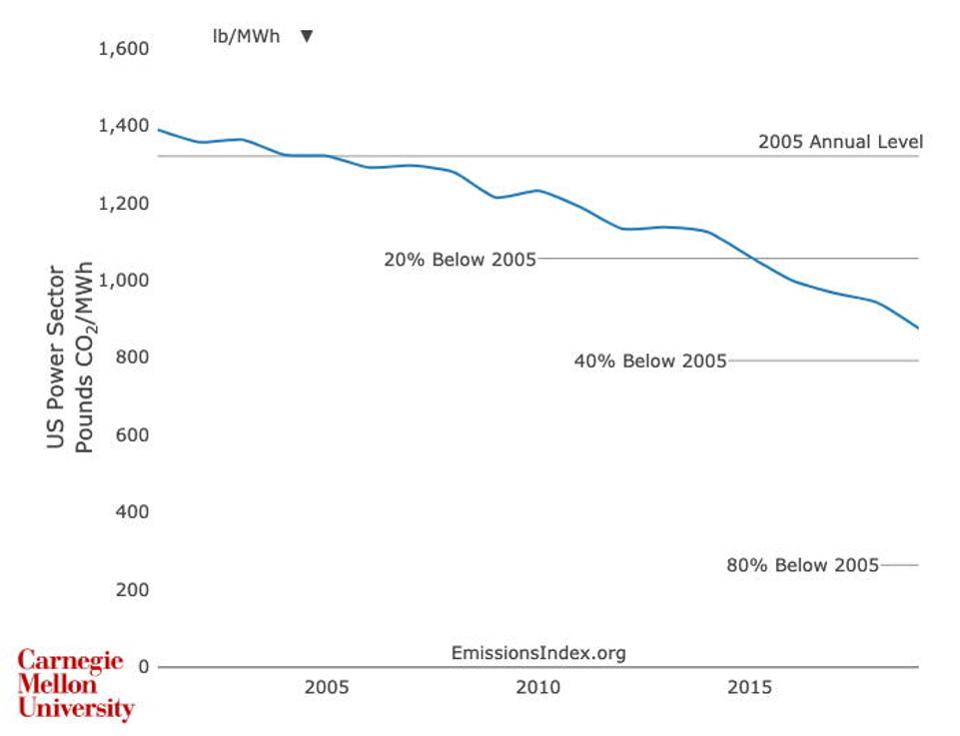
…has helped push carbon intensity below 400g per kWh
The overall carbon intensity of U.S. generation is now heading towards 33% below its 2005 levels, according to analysis by Carnegie Mellon’s Scott Institute for Energy Innovation. The country used to produce about 1,400 lbs of CO2 per MWh (or 1.4 lbs per kWh, slightly below the bottom end of coal’s range). Today, it produces just under 900 lbs per MWh or 0.9 lbs per kWh. In metric terms, 0.9 lbs is about 400 grams. In a recent tweet, Costa Samaras, co-director of the Power Index at the Scott Institute, noted the country had fallen below “400g/kWh for the first time ever.”
Lower renewable prices help
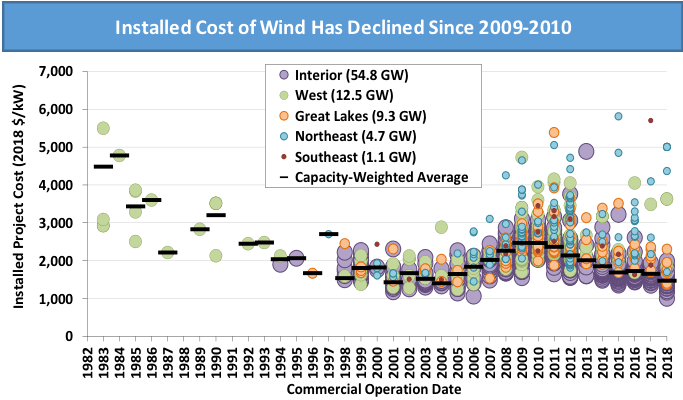
A further tailwind for this trend are plummeting wind and solar prices: A large wind farm costs 40% less than a decade ago (see chart below), and solar costs 80% less than 2010. While the EIA had reported that renewable supply had outpaced coal for the first time in time in April 2019, this was not seasonally adjusted. The EIA’s most recent projections show that 2020 will be the first year in which the country will produce more electricity from renewable power than coal.
Among all the damage caused by virus, this is a bright spot. Even as demand recovers, Kintigh won’t reopen.
Source: Lawrence Berkeley National Laboratory
Lowering Residential Carbon – The Short Version
Adding 10% to your monthly electricity bill could cut your footprint by 95%, in the one-sentence version.
This post follows an introductory piece for people interesting in reducing their personal carbon footprint. In the series, we review the five categories most research uses, namely 1) residential energy use, 2) travel, 3) food, 4) goods, and 5) services. This is the first in the series – in “key points” format. We’ve also written a longer piece that walks through the mechanics.
13 big black balloons
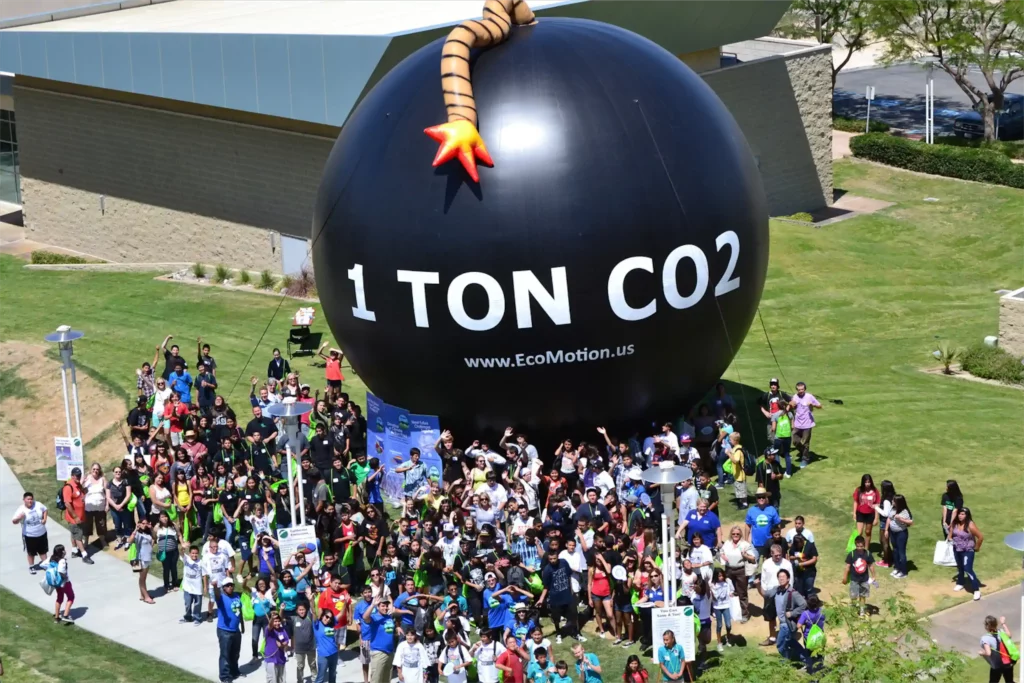
How much energy does the average American home use? It’s roughly 28,000 kWh per year. Given that only 11% of the national energy mix comes from renewables, each kWh of energy produces almost exactly 1 pound, or 0.4483 kg of carbon dioxide equivalents (CO2e) per year. This is CO2e-per-kWh figure is known as a conversion rate, and more on that below. These numbers together work out to about 12 metric tonnes of CO2e per year per home. (A metric tonne is a little bigger than a U.S. ton, so that’s a little over 13 U.S. tons.) It might be easier to visualize the volume of a ton of CO2, which would fill a giant balloon 10 yards in diameter.
The ton at an environmental expo in Palm Desert, California. Source: Carbon Visuals
Taking action, or how to get to half a balloon
Using less – cut your kWh by 20%
The actions households can take fall into two main categories: use less, and use renewable. Using less involves more conscious energy use, as well as upgrading fixtures in the house. Heating and cooling are the biggest energy users, accounting for around half of a home’s consumption, so a smart thermostat is probably the first change to make. Lighting accounts for 5% of residential energy use, but switching from all incandescent bulbs to all LEDs would cut that power use by about 90%. U.S. houses have begun to make the switch: 29% of U.S. houses report having at least one LED, and 18% report having no incandescent bulbs at all. Homes in the U.S. have on average 45 bulbs each, so it is not an enormous task. All in, with relatively modest investment in new fixtures, perhaps 20% savings are possible.
Renewable supply – make the switch for 6.5-15% extra
The real action, unsurprisingly, comes from switching to renewable supply. Is it a hassle? No. It involves selecting a reputable energy supply company (ESCO) by doing some online research, and completing a web form. No visits from technicians required. Is it expensive? It adds around 1 to 2 cents per kWh, but bigger differences are possible with variable plans offered by some ESCOs. As an example, Abest Power and Gas charged a range of $0.18 to $0.059 per kWh in the New York market between 2018 and 2020, while the non-renewable rate offered by Con Edison (also known as ConEd) was $0.07 to $0.10 per kWh over the same period.
Most electricity bills have two parts: a “supply” part (which is done by the ESCO), and a “delivery” part (which is the local utility, and you don’t have choice here; in New York it is ConEd). The delivery part has flat fees associated with customer billing and meter reading services. Changes to the cost of the supply part end up being more modest than they might seem, because parts of the bill are fixed. In the New York City market (which, to be sure, is known for its sales taxes and expensive electricity, at around $0.24 per kWh vs a national average of around $0.12), an extra 1.5 cents a per kWh for a 100% wind supply is about 6.5% on your monthly bill. Elsewhere, it will be closer to 10%, and in some markets up to 15%.
The total carbon effect – from 13 tons to half a ton
Switching to renewable supply doesn’t completely eliminate carbon, as there is some embedded carbon in transmission, generation, and maintenance (e.g., vehicles used to keep the grid running). But the conversion rate drops from about 0.44kg CO2e to 0.02kg. So even if your consumption didn’t change at all, 28,000 kWh would produce 0.56 metric tonnes of CO2e per year, rather than 12. Lower your kWh consumption a bit, and your home would produce less half of one balloon.
Residential Carbon Footprint – and How to Reduce It
This post follows an introductory piece for people interesting in reducing their personal carbon footprint. In the series, we review the five categories most research uses, namely 1) residential energy use, 2) travel, 3) food, 4) goods, and 5) services. This is the first in the series. Part of the goal of these “explainers” is to improve the general fluency of readers in sustainability topics, so we’ll start with some general numbers. And then to illustrate their practical application, we’ll compare them to this author’s household’s performance.
An American home produces over 13 tons of carbon each year
Household energy consumption is expressed in two main units: kilowatt hours (kWh) and British thermal units (BTUs). It is worth noting that a kilowatt is a unit of power (rate of energy transfer, or units of energy transferred in a given time), and a BTU is a unit of energy. Hence, multiplying kilowatts by hours (a measure of time) turns a power unit into an energy unit.
The kWh unit is intuitive: If a 100-Watt incandescent bulb were to run for an hour, that would consume 0.1 kWh, and ten such bulbs would consume 1000 Watts (or a kilo-Watt) in an hour. This is an “SI-unit” in that it belongs to the Système International of measurement, more commonly known as the metric system. A BTU is a non-SI measure, and belongs to the American system of measurement, known as United States customary units. It is defined as the amount of heat needed to raise one pound of water at maximum density through one degree Fahrenheit. One kWh is 3,412 BTUs.
The average American home uses, for electricity, 914 kWh per month, (or 10,972 kWh per year). But this doesn’t account for natural gas or fuel oil use for keeping rooms warm: In Pennsylvania, 2009 EIA data showed that half of all residential energy consumption went to space heating. Lots of things affect how much energy is used to heat a home; common-sense factors such as size, age, design, and climate all play a role, and this excellent guide is a useful tool for putting your home in context. One useful number to keep in mind is kWh per square-meter of floor space. An old house might need 200 kWh/m2 in a year, whereas a passive house might consume only 15kWh/m2 per year. Of note, American homes have grown over time too: in 1973, the average new home was 1,660 square feet (154 m2); in 2015, it was 2,687 square feet (250 m2). (As an aside, household size has been declining too, from 3.01 people to 2.54 over the same period, so living space per person nearly doubled from 1973 to 2015.)
Most homes are in the 5,000 kWh to 30,000 kWh per year range, for their heating energy cost. The average residence in Pennsylvania in 2009 used 96 million BTUs all in. Converting that to kWh gets you to around 28,135 kWh for the year for everything: heating (50%, or 14,000 kWh, is in the mid-point of the range above); cooling (3%); water heating (15%); and appliances and lighting (32%). That is, roughly, equivalent to burning around 10,000 pounds of coal. Pennsylvania may not be perfectly representative, but the ~28,000 kWh estimate lines up with ~20,000 kWh estimated by the U.S. Department of Energy and posted on Wikipedia.
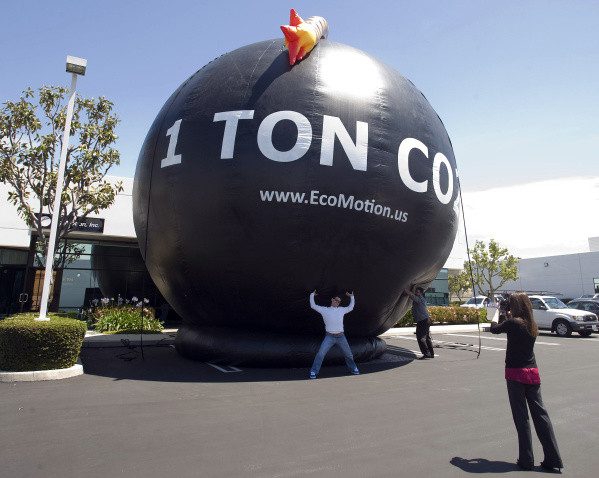
Consumers have choices about where they get their electricity from, but only about 11% of U.S. domestic electricity consumption came from renewable sources in 2016. So let’s take the national average – how much CO2 is produced per kWh of electricity? Or, to be more precise, how much “carbon dioxide equivalent” (CO2e), which takes into account other greenhouse gases, such as methane, which also warm the planet, and are produced in smaller quantities in the generation of power? The answer is almost exactly one pound, or 0.4483 kilograms. (This is known as a “conversion rate” – more on that below.) Assuming that all the energy consumed by a home in year produced the same carbon dioxide per kWh, 28,135 kWh results in 12,612 kg of CO2 per home per year. Assuming average household size of 2.54 people, that’s 4,965 kg per person per year. A larger household (say, a family of four) will produce only modestly more. 12.612 tonnes is 13.9 U.S. tons. A ton of a gas is not very intuitive to think about, so visualizing how much space it occupies is a easier. A one-ton spherical balloon of carbon dioxide is about 10 yards in diameter.
Source: Orange County Register
Action points, and some personal experience
The actions households can take fall into two obvious categories:
reduce consumption; and
switch to renewable supply. But how much can realistically be saved by following the energy saving tips advertised on the sides of local utility vehicles?
Reducing consumption
In our case, we cut consumption by 34%, from 1,329 kWh per month (15,947 for the year) in 2014, to 875 kWh per month (and 10,500 for the year) in 2019. Our apartment runs almost exclusively on electricity (heating/cooling, water heater, appliances and lighting – everything except the gas stove) so we had more levers to pull.
We replaced our windows, updated our thermostat, changed our bulbs to LEDs, installed a power meter by the sink, and increased our use of some ground-breaking technology in the shape of a drying rack. Changing the windows in mid-2015 has had the biggest effect. In January and February 2015, we consumed a total of 3,772 kWh (1,886 per month). In the same months in 2019, we consumed a total of 2,016 (1,008 per month), and in a mild 2020, that figure fell further to 1,718 (859 per month). In the peak heating months, the windows have saved us the bulk of 850-1,000 kWh monthly difference. That said, the other steps we took have turned out to be material too. We had tenants in the unit for some of 2018, and average monthly power consumption during their stay was 1627 kWh, or about twice ours in the equivalent months of the following year.
One area that we could cut further is “phantom” power consumption. When the apartment is empty, the fridge remains on, and the wi-fi and appliances remain either plugged in and off, or on standby. The daily energy cost is around 10 kWh; of which 1.7 kWh comes from the fridge. When the apartment is occupied, daily energy use is 30-35 kWh. Around 30%, in other words, of our power usage comes from just having appliances plugged in, which aren’t performing the energy-saving job of minimizing food waste.
Switching to renewable supply: the mechanics
On the power supply front, most wonder how it works, and what the additional cost is. Most electricity bills have two parts – the “supply charge” and the “delivery charge.” In the New York City market, consumers can choose which supplier (these are known as electricity supply companies, or ESCOs) they want, but they cannot choose the entity that delivers the electricity (in this case, it is ConEdison). Choosing among ESCOs allows consumers to find lower prices, and to gain access to “value-added services.” These include the ability to buy electricity from a renewable source, maintenance service, or tools to help manage energy use—all things which are generally not available from the local utility. Of note, actually switching ESCOs is painless: it requires completing a form online, or ringing a call center.
Dozens of ESCOs exist, and for our zip code 121 “offers” of plans were available in Q2 2020, of which over 50 were renewable. How do you know which to pick?
There are three main things to watch out for. One is the extent to which pricing fluctuates. Some ESCOs offer low first month rates, but then charge more after that. New York State runs a site called “Power to Choose” which allows consumers to see pricing, whether the energy supply is renewable, and – critically – historical pricing. Abest Power and Gas LLC, for example, offered $0.0654 per kWh for a renewable plan in April 2020, lower than ConEd’s $0.0658 for a non-renewable energy supply. Is this too good to be true? Yes, or at least partially. A review of historic pricing shows in Q1 2020, the company charged its customers $0.18 per kWh, while ConEd charged $0.0698. But in Q4 2019, Abest was lower than ConEd again, at $0.0599 vs. $0.0794. Hence, with this supplier, consumers will see (much) greater variability, and over the span of around 3 years, somewhat higher pricing per kWh.
The next thing to check is the type of renewable source. ESCOs can credibly claim to offer renewable energy by buying renewable energy certificates (sometimes known as renewable energy credits, or RECs). RECs are created when a renewable power generator (say, a wind farm) generates 1 megawatt hour (MWh, or 1,000 kWh) and delivers it to the grid. Once a REC exists, it can be traded, and ultimately “consumed” by power users in businesses and homes who don’t otherwise have the ability to install their own solar panels or wind turbines. The ESCOs that supply renewable energy to New York essentially all use RECs to substantiate their claim that the power they are supplying is indeed renewable. That said, some RECs have a more positive impact on the renewable energy market than others. Some states classify RECs into tiers, with Tier 1 applying to RECs that come from the cleanest possible sources (usually new, wind and solar), with Tiers 2 and 3 generally referring to biomass and hydropower. (Some biomass projects can qualify to be Tier 1 if they meet certain feedstock and conversion technology criteria.) The main point for a consumer is to check what renewable energy is behind the REC, and try and select suppliers that list themselves as “100% wind” or “100% solar” if possible.
The final thing to check is how reputable the ESCO is. Aggressive sales tactics and low teaser rates at times have characterized the market, so resources like the Better Business Bureau and the New York State Department of Public Service Complaint Statistics Report are worth checking. A general common sense review of the underlying business is worth it too. Constellation may not perfect, but it claims to supply two-thirds of the Fortune 500, and may have more brand equity to lose from deceptive marketing than other suppliers.
Switching to renewable supply: the cost
ConEd’s price for a kWh supplied was $0.0698 in Q1 2020, and over the last three years renewable suppliers have charged between $0.06 and $0.18 per kWh. Our ESCO is Constellation New Energy, and prices in 2019 and 2020 ranged from $0.0849 to $0.099. Note that the ConEd delivery charge of around $0.13 per kWh is added to that, along with various taxes and fees. One fee is the flat $15.47 monthly “basic service charge” for running customer accounting and meter reading services. Another is the variable $0.005 per kWh “system benefit charge” which helps pay for clean energy activities conducted by the New York State Energy Research and Development Authority, and energy efficiency programs implemented by ConEd.
All in, we know from the Bureau of Labor Statistics that the average cost of a kWh for households in the New York City area (New York, Jersey City and Newark) was $0.21 in February 2020, and we know from experience that New York City households pay an extra 4.5% sales tax, on both supply and delivery parts of the bill. Our February 2020 bill came in at $0.259 for 877 kWh, or $227.49, using 100% renewable wind power. What if we had used ConEd’s $0.0698 supply rate, rather than the $0.0849 Constellation charges us? The supply part of our bill would have fallen by $13.84, from $77.81 to $63.97. The delivery part of our bill wouldn’t have changed. So the overall saving would have been 4.99%.
Switching to renewable supply: the effect on carbon
Does switching to renewable supply completely eliminate the carbon footprint of household energy consumption? Almost, but not quite. This is partly explained by the carbon embedded in manufacturing the equipment required for generation, as well as some involved in transmission. For our 10,500 annual kWh budget, Resurgence estimates we would produce 4515 kg of carbon on a normal tariff (a conversion rate of 0.43 kg CO2e per kWh, slightly lower than the U.S. figure of 0.44 cited above), and 210 kg on a 100% renewable plan (a conversion rate of 0.02). So the reduction is around 95%. Coal emits 1.4-3.6 pounds of CO2e per kWh, natural gas 0.6-2 pounds, solar 0.07-0.2 pounds, and wind 0.02-0.04 pounds. A study by the U.S. Department of Energy’s National Renewable Energy Laboratory (NREL) found that switching 80% of the country’s energy supply to renewable sources by 2050 would cut the electricity sector’s emissions by 81%.
Source: Union of Concerned Scientists
The total carbon effect of taking action
What might the effect be for the general American home? If we assume modest changes to the house (such as upgrading the thermostat and installing LEDs, but not replacing windows) and changes in behavior, perhaps a 20% cut in energy use is feasible. 28,000 kWh would fall to 22,400. Applying a kWh to CO2e conversion rate of 0.02 associated with 100% renewable power, the average American home would go from producing 12,600 kg of carbon per year, to 448 kg. Or from over 13 big balloons to about half of one.
Key takeaways
An American home consumes around 28,000 kWh per year. At the current national energy mix, of which only 11% is renewable, this produces over 12 metric tonnes (over 13 U.S. tons) of carbon dioxide each year.
Conscious energy use can make a substantial difference. Through upgrading windows, light fixtures, and thermostats, as well as modifying behavior, we cut average monthly kWh consumption by one-third.
Switching to renewable power requires modest homework, but is otherwise painless. The supply cost is around two cents higher per kilowatt hour. Going from our current 100% wind supply arrangement back to non-renewable sources would cut our electricity bill by 5%.
There is some residual carbon footprint from switching to a 100% wind or solar supply arrangement. But it is only about 5% of the footprint associated with regular power supply.
Equipment changes, behavior changes, and supply changes could cut annual American residential carbon dioxide equivalent production from over 13 tons to about half of one ton.