
This post follows an introductory piece for people interesting in reducing their personal carbon footprint. In the series, we review the five categories most research uses, namely 1) residential energy use, 2) travel, 3) food, 4) goods, and 5) services. This is the first in the series. Part of the goal of these “explainers” is to improve the general fluency of readers in sustainability topics, so we’ll start with some general numbers. And then to illustrate their practical application, we’ll compare them to this author’s household’s performance.
Household energy consumption is expressed in two main units: kilowatt hours (kWh) and British thermal units (BTUs). It is worth noting that a kilowatt is a unit of power (rate of energy transfer, or units of energy transferred in a given time), and a BTU is a unit of energy. Hence, multiplying kilowatts by hours (a measure of time) turns a power unit into an energy unit.
The kWh unit is intuitive: If a 100-Watt incandescent bulb were to run for an hour, that would consume 0.1 kWh, and ten such bulbs would consume 1000 Watts (or a kilo-Watt) in an hour. This is an “SI-unit” in that it belongs to the Système International of measurement, more commonly known as the metric system. A BTU is a non-SI measure, and belongs to the American system of measurement, known as United States customary units. It is defined as the amount of heat needed to raise one pound of water at maximum density through one degree Fahrenheit. One kWh is 3,412 BTUs.
The average American home uses, for electricity, 914 kWh per month, (or 10,972 kWh per year). But this doesn’t account for natural gas or fuel oil use for keeping rooms warm: In Pennsylvania, 2009 EIA data showed that half of all residential energy consumption went to space heating. Lots of things affect how much energy is used to heat a home; common-sense factors such as size, age, design, and climate all play a role, and this excellent guide is a useful tool for putting your home in context. One useful number to keep in mind is kWh per square-meter of floor space. An old house might need 200 kWh/m2 in a year, whereas a passive house might consume only 15kWh/m2 per year. Of note, American homes have grown over time too: in 1973, the average new home was 1,660 square feet (154 m2); in 2015, it was 2,687 square feet (250 m2). (As an aside, household size has been declining too, from 3.01 people to 2.54 over the same period, so living space per person nearly doubled from 1973 to 2015.)
Most homes are in the 5,000 kWh to 30,000 kWh per year range, for their heating energy cost. The average residence in Pennsylvania in 2009 used 96 million BTUs all in. Converting that to kWh gets you to around 28,135 kWh for the year for everything: heating (50%, or 14,000 kWh, is in the mid-point of the range above); cooling (3%); water heating (15%); and appliances and lighting (32%). That is, roughly, equivalent to burning around 10,000 pounds of coal. Pennsylvania may not be perfectly representative, but the ~28,000 kWh estimate lines up with ~20,000 kWh estimated by the U.S. Department of Energy and posted on Wikipedia.
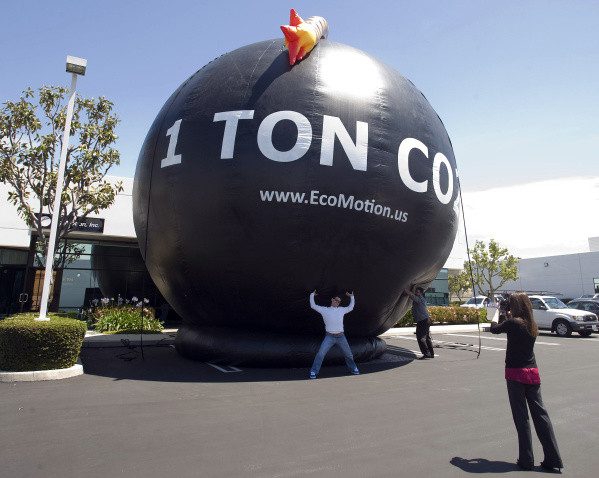
Consumers have choices about where they get their electricity from, but only about 11% of U.S. domestic electricity consumption came from renewable sources in 2016. So let’s take the national average – how much CO2 is produced per kWh of electricity? Or, to be more precise, how much “carbon dioxide equivalent” (CO2e), which takes into account other greenhouse gases, such as methane, which also warm the planet, and are produced in smaller quantities in the generation of power? The answer is almost exactly one pound, or 0.4483 kilograms. (This is known as a “conversion rate” – more on that below.) Assuming that all the energy consumed by a home in year produced the same carbon dioxide per kWh, 28,135 kWh results in 12,612 kg of CO2 per home per year. Assuming average household size of 2.54 people, that’s 4,965 kg per person per year. A larger household (say, a family of four) will produce only modestly more. 12.612 tonnes is 13.9 U.S. tons. A ton of a gas is not very intuitive to think about, so visualizing how much space it occupies is a easier. A one-ton spherical balloon of carbon dioxide is about 10 yards in diameter.
The actions households can take fall into two obvious categories:
Reducing consumption
In our case, we cut consumption by 34%, from 1,329 kWh per month (15,947 for the year) in 2014, to 875 kWh per month (and 10,500 for the year) in 2019. Our apartment runs almost exclusively on electricity (heating/cooling, water heater, appliances and lighting – everything except the gas stove) so we had more levers to pull.
We replaced our windows, updated our thermostat, changed our bulbs to LEDs, installed a power meter by the sink, and increased our use of some ground-breaking technology in the shape of a drying rack. Changing the windows in mid-2015 has had the biggest effect. In January and February 2015, we consumed a total of 3,772 kWh (1,886 per month). In the same months in 2019, we consumed a total of 2,016 (1,008 per month), and in a mild 2020, that figure fell further to 1,718 (859 per month). In the peak heating months, the windows have saved us the bulk of 850-1,000 kWh monthly difference. That said, the other steps we took have turned out to be material too. We had tenants in the unit for some of 2018, and average monthly power consumption during their stay was 1627 kWh, or about twice ours in the equivalent months of the following year.
One area that we could cut further is “phantom” power consumption. When the apartment is empty, the fridge remains on, and the wi-fi and appliances remain either plugged in and off, or on standby. The daily energy cost is around 10 kWh; of which 1.7 kWh comes from the fridge. When the apartment is occupied, daily energy use is 30-35 kWh. Around 30%, in other words, of our power usage comes from just having appliances plugged in, which aren’t performing the energy-saving job of minimizing food waste.
Switching to renewable supply: the mechanics
On the power supply front, most wonder how it works, and what the additional cost is. Most electricity bills have two parts – the “supply charge” and the “delivery charge.” In the New York City market, consumers can choose which supplier (these are known as electricity supply companies, or ESCOs) they want, but they cannot choose the entity that delivers the electricity (in this case, it is ConEdison). Choosing among ESCOs allows consumers to find lower prices, and to gain access to “value-added services.” These include the ability to buy electricity from a renewable source, maintenance service, or tools to help manage energy use—all things which are generally not available from the local utility. Of note, actually switching ESCOs is painless: it requires completing a form online, or ringing a call center.
Dozens of ESCOs exist, and for our zip code 121 “offers” of plans were available in Q2 2020, of which over 50 were renewable. How do you know which to pick?
There are three main things to watch out for. One is the extent to which pricing fluctuates. Some ESCOs offer low first month rates, but then charge more after that. New York State runs a site called “Power to Choose” which allows consumers to see pricing, whether the energy supply is renewable, and – critically – historical pricing. Abest Power and Gas LLC, for example, offered $0.0654 per kWh for a renewable plan in April 2020, lower than ConEd’s $0.0658 for a non-renewable energy supply. Is this too good to be true? Yes, or at least partially. A review of historic pricing shows in Q1 2020, the company charged its customers $0.18 per kWh, while ConEd charged $0.0698. But in Q4 2019, Abest was lower than ConEd again, at $0.0599 vs. $0.0794. Hence, with this supplier, consumers will see (much) greater variability, and over the span of around 3 years, somewhat higher pricing per kWh.
The next thing to check is the type of renewable source. ESCOs can credibly claim to offer renewable energy by buying renewable energy certificates (sometimes known as renewable energy credits, or RECs). RECs are created when a renewable power generator (say, a wind farm) generates 1 megawatt hour (MWh, or 1,000 kWh) and delivers it to the grid. Once a REC exists, it can be traded, and ultimately “consumed” by power users in businesses and homes who don’t otherwise have the ability to install their own solar panels or wind turbines. The ESCOs that supply renewable energy to New York essentially all use RECs to substantiate their claim that the power they are supplying is indeed renewable. That said, some RECs have a more positive impact on the renewable energy market than others. Some states classify RECs into tiers, with Tier 1 applying to RECs that come from the cleanest possible sources (usually new, wind and solar), with Tiers 2 and 3 generally referring to biomass and hydropower. (Some biomass projects can qualify to be Tier 1 if they meet certain feedstock and conversion technology criteria.) The main point for a consumer is to check what renewable energy is behind the REC, and try and select suppliers that list themselves as “100% wind” or “100% solar” if possible.
The final thing to check is how reputable the ESCO is. Aggressive sales tactics and low teaser rates at times have characterized the market, so resources like the Better Business Bureau and the New York State Department of Public Service Complaint Statistics Report are worth checking. A general common sense review of the underlying business is worth it too. Constellation may not perfect, but it claims to supply two-thirds of the Fortune 500, and may have more brand equity to lose from deceptive marketing than other suppliers.
Switching to renewable supply: the cost
ConEd’s price for a kWh supplied was $0.0698 in Q1 2020, and over the last three years renewable suppliers have charged between $0.06 and $0.18 per kWh. Our ESCO is Constellation New Energy, and prices in 2019 and 2020 ranged from $0.0849 to $0.099. Note that the ConEd delivery charge of around $0.13 per kWh is added to that, along with various taxes and fees. One fee is the flat $15.47 monthly “basic service charge” for running customer accounting and meter reading services. Another is the variable $0.005 per kWh “system benefit charge” which helps pay for clean energy activities conducted by the New York State Energy Research and Development Authority, and energy efficiency programs implemented by ConEd.
All in, we know from the Bureau of Labor Statistics that the average cost of a kWh for households in the New York City area (New York, Jersey City and Newark) was $0.21 in February 2020, and we know from experience that New York City households pay an extra 4.5% sales tax, on both supply and delivery parts of the bill. Our February 2020 bill came in at $0.259 for 877 kWh, or $227.49, using 100% renewable wind power. What if we had used ConEd’s $0.0698 supply rate, rather than the $0.0849 Constellation charges us? The supply part of our bill would have fallen by $13.84, from $77.81 to $63.97. The delivery part of our bill wouldn’t have changed. So the overall saving would have been 4.99%.
Switching to renewable supply: the effect on carbon
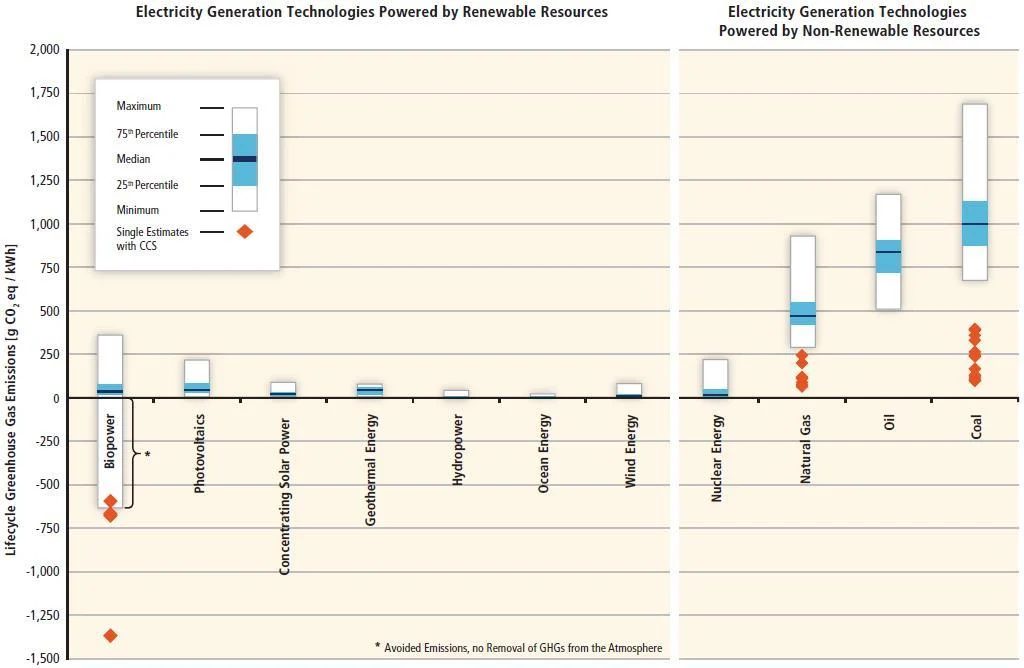
Does switching to renewable supply completely eliminate the carbon footprint of household energy consumption? Almost, but not quite. This is partly explained by the carbon embedded in manufacturing the equipment required for generation, as well as some involved in transmission. For our 10,500 annual kWh budget, Resurgence estimates we would produce 4515 kg of carbon on a normal tariff (a conversion rate of 0.43 kg CO2e per kWh, slightly lower than the U.S. figure of 0.44 cited above), and 210 kg on a 100% renewable plan (a conversion rate of 0.02). So the reduction is around 95%. Coal emits 1.4-3.6 pounds of CO2e per kWh, natural gas 0.6-2 pounds, solar 0.07-0.2 pounds, and wind 0.02-0.04 pounds. A study by the U.S. Department of Energy’s National Renewable Energy Laboratory (NREL) found that switching 80% of the country’s energy supply to renewable sources by 2050 would cut the electricity sector’s emissions by 81%.
The total carbon effect of taking action
What might the effect be for the general American home? If we assume modest changes to the house (such as upgrading the thermostat and installing LEDs, but not replacing windows) and changes in behavior, perhaps a 20% cut in energy use is feasible. 28,000 kWh would fall to 22,400. Applying a kWh to CO2e conversion rate of 0.02 associated with 100% renewable power, the average American home would go from producing 12,600 kg of carbon per year, to 448 kg. Or from over 13 big balloons to about half of one.
Key takeaways